
SBI General is a private general insurance company which established in 2009, with the strong parentage of SBI. SBI-G’s consumer centric approach galvanizes the overall process and adds value to the firms and consumers. It has built a successful model over a period and attracts more customers to its bandwidth due to their customer centricity approach.
It has an enormous customer base & has served 340 million customers till FY23. During the same time, it has expanded its presence to over 141 branches pan-India. The widespread network of distributors helped them to grow very rapidly over one & half a decade, which now is further accelerated with the presence of 22,437+ SBI branches, agents, other financial alliances, OEMs, & digital partners. This enables them to extend their reach to the pocketed remote areas of India. They also offer a bouquet of products spread across various lines of businesses that cater to customers across all segments like Retail, Corporate, SME and Rural, ensuring accessibility via digital as well as physical modes.
It offers a bouquet of products spread across various lines of businesses to cater to the customers across all segments like Retail, Corporate, SME and Rural, ensuring accessibility via digital as well as physical modes. Their product list consists of: -
| Name of Share Holders | % of Share Holding |
|---|---|
| State Bank of India | 69.74 |
| Napean Opportunities LLP | 15.95 |
| Honey Wheat Investment Ltd | 9.99 |
| PI Opportunities Fund-1 | 2.34 |
| Income Statement | Q2'24 | FY23 | FY22 | FY21 | FY20 | FY19 | FY18 |
|---|---|---|---|---|---|---|---|
| Operating Profit | |||||||
| Fire Insurance | 209.83 | 304.78 | 306.01 | 378.74 | 313.96 | 190.89 | 331.12 |
| Marine Insurance | -32.93 | -41.25 | -27.29 | -14.5 | -0.47 | -5.29 | -1.11 |
| Miscellaneous Insurance | -234.4 | -127.73 | -353.46 | 149.89 | 161.43 | 176.42 | 47.28 |
| Income from Investment | |||||||
| Interest, Dividend & Rent | 76.73 | 129.5 | 122.75 | 135.61 | 117.84 | 107.29 | 100.18 |
| Profit on Sale of Investment | 86.55 | 118.98 | 171.68 | 78.54 | 38.45 | 19.12 | 9.69 |
| Loss in Sale of Investment | -18.23 | -43.1 | -23.46 | -8.1 | -40.2 | -3.26 | -0.12 |
| Other Income | 0.5 | 13.28 | 1.22 | 3.94 | 0.24 | 1.1 | 0.7 |
| Total Income | 87.29 | 354.56 | 208.6 | 724.19 | 591.27 | 486.31 | 487.75 |
| Provisions | -2.09 | 20.62 | 5.84 | -4.1 | -5.9 | 13.11 | 2.86 |
| Other Expenses | 5.17 | 89.24 | 24.32 | 10.8 | 32.4 | 3.3 | 62.3 |
| Total Expenses | 3.08 | 110.22 | 30.63 | 6.17 | 26.87 | 16.52 | 65.35 |
| Profit before Tax | 84.21 | 244.33 | 177.98 | 717.92 | 564.41 | 469.79 | 422.38 |
| Profit after Tax | 59.86 | 184.22 | 131.23 | 543.59 | 411.76 | 333.99 | 395.69 |
| Earnings per Share | 2.75 | 8.54 | 6.09 | 25.22 | 19.11 | 15.5 | 18.36 |
| Balance Sheet | Q2'24 | FY23 | FY22 | FY21 | FY20 | FY19 | FY18 |
|---|---|---|---|---|---|---|---|
| Share Capital | 221.36 | 215.64 | 215.62 | 215.5 | 215.5 | 215.5 | 215.5 |
| Reserves & Surplus | 3,630 | 2,844.14 | 2,658.27 | 2,520.63 | 1,998.58 | 1,608.37 | 1,332.60 |
| Investment- Shareholder | 168.9 | 2,643.38 | 2,498.25 | 2,218.04 | 1,792.66 | 1,421.77 | 1,185.54 |
| Investment Policyholder | - | 10,451.61 | 8,420.83 | 7,359.98 | 5,634.29 | 4,934.80 | 4,106.64 |
| Fixed Asset | 256.45 | 256.85 | 225.9 | 213.58 | 111.67 | 90.97 | 56.2 |
| Deferred Tax | 21.88 | 21.67 | 16.17 | 16.75 | 16.59 | 42.21 | 36.58 |
| Cash & Bank Balance | 277.13 | 135.23 | 157.58 | 430.8 | 212.1 | 183.1 | 39.02 |
| Advances & Other Asset | 1,988.69 | 1,771.16 | 1,402.16 | 1,141.97 | 1,527.42 | 1,730.79 | 501.47 |
| Total Asset | 2,265.81 | 1,906.39 | 1,559.74 | 1,572.79 | 1,739.53 | 887.44 | 540.49 |
| Current Liability | 8,591.14 | 8,133.93 | 6,595.32 | 5,540.80 | 4,763.62 | 3,825.94 | 2,879.74 |
| Provisions | 4,524.53 | 4,072.88 | 3,152.89 | 3,024.78 | 2,400.37 | 1,730.79 | 1,558.91 |
| Total Liability | 13,115.67 | 12,206.81 | 9,748.21 | 8,565.59 | 7,164 | 5,556.72 | 4,438.65 |
| Miscellaneous | FY23 | FY22 | FY21 | FY20 | FY19 | FY18 |
|---|---|---|---|---|---|---|
| Gross Written Premium | 10,888.44 | 9,259.52 | 8,311.6 | 6,839.79 | 4,717.26 | 3,553.21 |
| Gross Direct Premium | 10,828.39 | 9,166.22 | 8,264.86 | 6,796.97 | 4,706.55 | 3,544.2 |
| Underwritten Profit | -570.39 | -621.69 | 16.87 | 74.84 | 82.22 | 94.34 |
| Investment & Other Income | 814.72 | 799.66 | 701.05 | 489.57 | 387.57 | 328.05 |
| Profit Before Tax | 244.33 | 177.97 | 717.92 | 564.41 | 469.79 | 422.39 |
| Profit After Tax | 184.23 | 131.23 | 543.59 | 411.76 | 333.99 | 395.7 |
| EPS | 8.54 | 6.09 | 25.22 | 19.11 | 15.5 | 18.36 |
| Solvency Ratio | 1.72 | 1.85 | 2 | 2.27 | 2.34 | 2.54 |
| Cash Flow Statements | FY23 | FY22 | FY21 | FY20 | FY19 | FY18 |
|---|---|---|---|---|---|---|
| Cash flows from Operating | ||||||
| Premium received from policyholder | 12,022.19 | 10,326.10 | 9,471.18 | 6,974.45 | 5,017.36 | 3,636.40 |
| Payment to re-insurers | -2,521.29 | -1,963.05 | -1,681.68 | -1,371.96 | -1,076.67 | -1,012.39 |
| Payment to co-insurers | 311.99 | 304.45 | 200.9 | 92.86 | -385.59 | -10.02 |
| Payment to claims | -5,382.14 | -5,782.68 | -4,119.55 | -3,024.74 | -2,006.37 | -1,074.24 |
| Payment of commission & brokerage | -936.84 | -759.39 | -642.05 | -560.37 | -385.59 | -286.68 |
| Payments of other operating expenses | -1,591.24 | -1,344.49 | -1,065.45 | -825.51 | -534.72 | -541.04 |
| Income Tax | -26.84 | -95.79 | -139.83 | -113.49 | -177.87 | -63.28 |
| Service Tax | -367.53 | -327.79 | -282.86 | -388.66 | 75.98 | -73.69 |
| Retirement Benefits | -12.91 | -10.86 | -11.19 | -7.82 | -7.26 | -6.72 |
| Net Cash Flow from Operation | 1,498.10 | 357.69 | 1,729.54 | 771.51 | 918.09 | 568.18 |
| Cash Flows from Investing | ||||||
| Purchase of Fixed Asset | -89.09 | -89.47 | -164.42 | -62.07 | -78.29 | -43.64 |
| Purchase of Investments | -8,646.20 | -11,719.89 | -6,817.85 | -5,039.94 | -2,472.75 | -1,767.62 |
| Sale of Investments | 6,554.22 | 10,736.14 | 5,273.26 | 3,887.19 | 1,170.71 | 1,094 |
| Rent/ Interest/Dividend | 725.18 | 580.06 | 540.35 | 464.63 | 374.41 | 359.63 |
| Investment in money market | 92.9 | -498.98 | 35.61 | 98.66 | 158.75 | -121.81 |
| Net Cash Flow from Investing | -1,360.82 | -992.08 | -1140.6 | -649.6 | -848.34 | -381.03 |
| Cash Flow from Financing | ||||||
| Proceed from issuance of share capital | 1.68 | 6.53 | -21.55 | -21.55 | -4.43 | - |
| Net Cash Flow from Financing | 1.68 | 6.53 | -21.55 | -21.55 | 65.32 | 186.87 |
SBIGs expanded their services to over 34 crore customers, increasing their market share to 4.21% in FY23, from 4.15% in FY22. In FY23, it was placed sixth among private insurers. It also witnessed a significant boost, especially in the Health and Motor lines of business, with a growth of 50% and 17%, respectively. SBIG had a solvency ratio of 1.72 as against the minimum regulatory requirement of 1.50. It has no investments in immovable property or derivative instruments.
SBIG was assigned corporate credit rating of “AAA/Stable” by CRISIL. This indicates that it has the highest credit rating, has a fundamentally strong position and the prospect of meeting its obligations is the best.
The main functionary of general insurance is to foresee the interests of people or an entity from uncertain risk. Insurance provides cushion & helps to recover from damage or loss of valuable goods in an unwanted accident for which consumers buy an insurance policy and are required to pay a recurring premium.
SBIG has built a robust multi-distribution model encompassing bancassurance, agency, broking, retail direct channels and digital tie-ups. Armed with SBI’s robust network and SBI General's expertise, it has put it in an ideal state to serve every Indian across the country. Overall, general insurance industry registered a growth of 16% in FY23, primarily driven by the health segment, which continues to be the largest contributor & witnessed a strong growth across its various lines of business, including home, health, personal accident, commercial lines, and crop. Consistent performance has propelled them to the sixth position among private general insurers, bettering one better from last fiscal year.
India has been one of the fastest growing economies for almost a decade and its upcoming future projections seems to be considerably way ahead than others. Although, the last couple of years were disrupted by Covid-19 and Ukraine war which directly impacted the growth of several economies across the globe, the recent turnaround and policies played a significant role in realigning the sector. The general insurance sector in India has been growing at a healthy rate in recent times, driven by increasing awareness about the importance of insurance and rising income levels. According to a report by Investment Information and Credit Rating Agency (ICRA), the sector is expected to grow at a CAGR of around 13% between 2021-2025
India is placed at 10th position in the Insurance market (9th – Life & 13th – non-life). It is estimated to grow by an average of 14% per annum over the next decade which will shoot up it’s ranking to sixth position. This increase is mainly due to overall economic growth of India & FDI inflows specifically in the insurance sector which showed a remarkable growth of 20 times over last 2 decades because of relaxation in policies by government.
As far as non-life business is concerned health premium in India grew by 22.5% in real terms. This segment became the largest non-life business contributor due to awareness amongst the public and the rapid increase in healthcare cost. Moreover, post pandemic and customization of policies are further helping to boom this market.
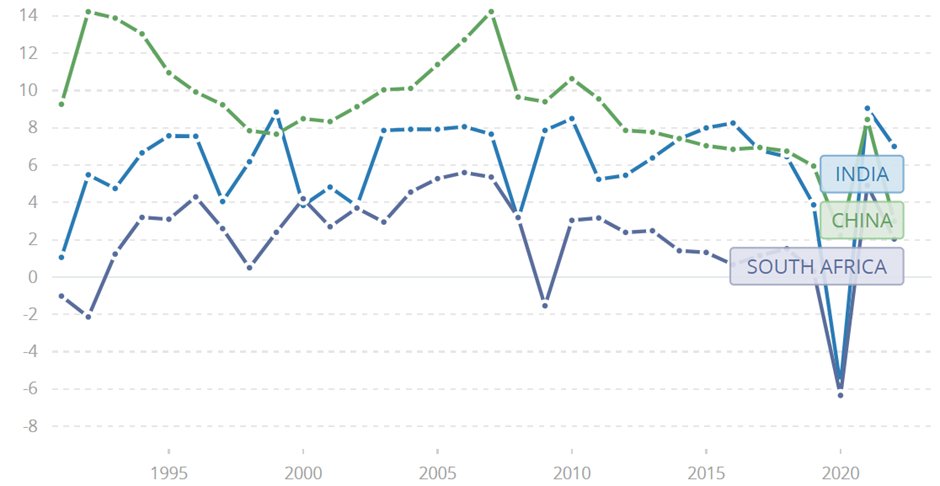
Indian economy has been on a juggernaut run, & future prospect looks bright too after all the sectors are firing at all the cylinders and keeping up the capital expenditure from both government and private players. IMF and World Bank forecasts India’s GDP growth for FY23/24 to be at 6.3%. The expected moderation is mainly due to challenging external conditions and waning pent-up demand. However, service sector activity is expected to remain strong with growth of 7.4% and investment growth is also projected to remain robust at 8.9%.
The magnitude of resurgence of insurance business can be derived from the fact that India is home of 1.4 billion people which is also a favoured tourist attraction, and has various small-scale businesses & conglomerates. Insurance industry revival can also be determined by increased FDI which benefits the overall size of the industry. The Government of India had increased the limit of Foreign Direct Investment (FDI) in insurance industry from 49% to 74% through Finance Act, 2021.
The investment income of all general and health insurers during 2021-22 was INR 32,546 crore registering a growth of 9.42%.
| Insurer (INR Crore) | FY20 | FY21 | FY22 |
|---|---|---|---|
| Public Sector Insurer | 15,300.37 | 14,529 | 14,610 |
| Private Sector Insurer | 11,181.55 | 12,745.46 | 14,654 |
| Standalone Health Insurer | 740.71 | 805.4 | 1,277.19 |
| Specialized Insurer | 1,382.89 | 1,663.21 | 2,005.15 |
| Total | 7,151.38 | 29,743.55 | 32,546.49 |
Acceptance of the insurance market is very much timid & used to be on a lower range. This was mainly due to un-awareness, low disposable income and drawn-out accessibility. This has taken a leap post opening of the market. Insurance industry has improved drastically & India was positioned 10th in global insurance business with a market share of 1.85 % as per the last update done in 2021. Total insurance premium is gradually increasing in India by 13.46% in 2021 whereas global total insurance premium increased by just 9.04% during the same time.
By every stretch of imagination, India is inclined more towards life insurance business catering to personal prospects & family commitments. In life insurance business, India was ranked ninth in 2021 doing one better than previous year in the world. India's share in global life insurance market was 3.23 % (3.11% in 2020) during 2021. Life insurance premium in India increased by 14.16% in 2021, whereas global life insurance premium increased by just 9.91%.
In non-life insurance business which includes Health, Travel, Business, Automobiles etc, India is ranked 14th in the world. India's share in global non-life insurance market was 0.78 % in 2021. Although, with thriving economy, better regulations & ecosystem, ease of process & awareness of products has put non-life insurance industry on a better growth trajectory. The non-life insurance is anticipated to grow at 14-15% for the next decade. Globally, the share of life insurance business in total premium was 43.69 % and the share of non-life insurance premium was 56.31% during 2021. However, the share of life insurance business for India was still high at 76.14% while the share of non-life insurance business was at 23.86 %.
Insurance companies work on the principal of shared value which galvanizes things and adds value to the firms and consumers. This has built a successful model over a period and attracts more beneficiaries to subscribe for the common cause. SBIG’s future strategy is to cater and acquire consumers from digital medium to minimize the acquisition cost, leveraging with the help of platform like YONO application along with existing tie ups. They have on-boarded new digital partners as well, providing additional reach through Regional Rural Banks(full-form), Financial Corporations, NBFCs, & Retail Broker tie-ups which have also increased during the year.
It had launched several products: - Bharat Graha Raksha, Bharat Sookshma Udyam Suraksha and Bharat Laghu Udyam Suraksha along with Arogya Supreme to capitalize on the new opportunity in profitable retail segment. It is now preferred insurance partner of Hero, Escorts, Swaraj Mazda, Isuzu and Yamaha in the motor insurance segment, taking their total motor OEM tie-ups to 19. On the distribution front, it has enabled the expansion by new corporate agency tie ups with leading Banks and Cooperative societies.
SBIG has been awarded ‘Insurer of the Year’ in the Non-Life category at FICCI Insurance Industry Awards, for two consecutive years.
Ranked No. 1 under General Insurance by YouGov Finance Purchase Rankings for 2021.
Shri Dinesh Kumar Khara - Chairman
Shri Kishore Kumar Poluda – MD & CEO
Shri Rikhil Shah – Chief Financial Officer
Shri Neil VAZ – Chief Risk Officer
Shri Samir Chhabra – Head Corporate Strategy
For any queries, reach out to: unlisted@rurashfin.com or Call: +91 224157 1111