
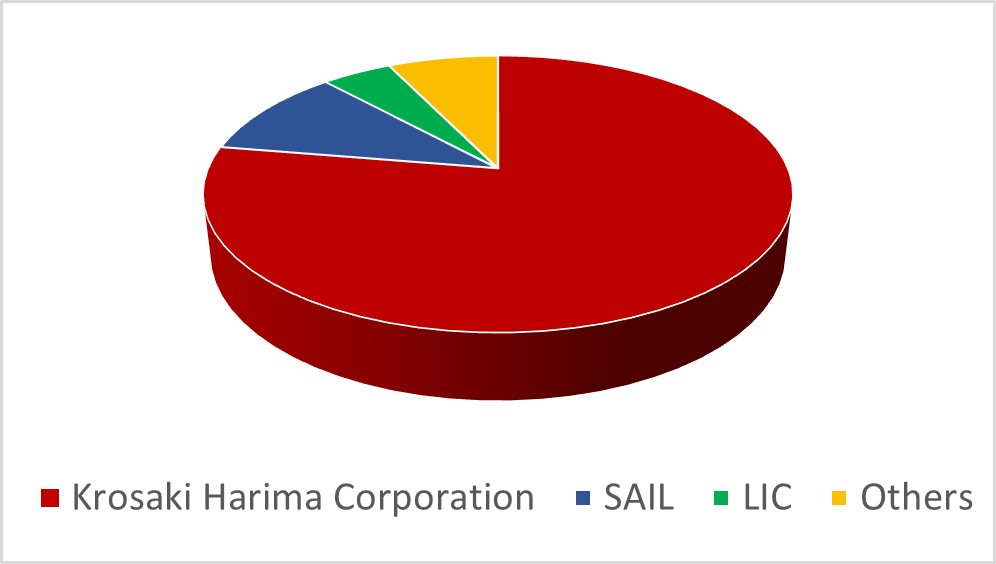
TRL Krosaki is one of the leading refractories manufacturers & also an IMS certified company in India. TRL parent organisation is “Krosaki Harima Corporation” (77.62 %) which is a century old firm which carries a rich heritage, brings in reliable input & expertise that allows them to form synergy & complement each other.
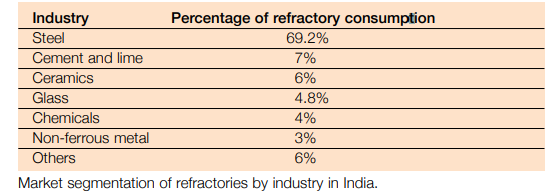
About 70% of world refractories’ production is consumed by steel industry. In India steel industry consumes around 75% of refractories produced.
Basic Bricks, Dolomite, Fireclay & High Alumina, Silica, Flow Control, Monolithic, Engineering Services, RH Snorkel, Taphole Clay, Alumina Graphite.
TRL has approximately 70-75% market share in dolomite refractories in domestic market.
| DESCRIPTION | Mar-23 | Mar-22 | Mar-21 | Mar-20 | Mar-19 | Mar-18 |
|---|---|---|---|---|---|---|
| Total Income | 2,299.15 | 1,923.97 | 1,427.67 | 1,653.76 | 1,594.29 | 1,176.69 |
| Total Expenditure | 2,030.39 | 1,740.88 | 1,339.12 | 1,479.00 | 1,414.55 | 1,067.94 |
| PBT | 210.67 | 137.13 | 46.54 | 131.38 | 129.95 | 72.46 |
| PAT | 158.27 | 103.74 | 35.71 | 101.18 | 84.12 | 47.03 |
| Debt to Equity | 0.36 | 0.52 | 0.42 | 0.47 | 0.51 | 0.45 |
| Current Ratio | 1.4 | 1.37 | 1.43 | 1.56 | 1.37 | 1.36 |
| EPS | 75.73 | 49.64 | 21.28 | 48.18 | 40.53 | 22.50 |
Refractories hold a vital position in the steel industry because of their direct relation and involvement in the manufacturing costs and product quality. As a result of rising user demands for higher product quality, refractory technology too has evolved & improved along with the development of steel manufacturing processes to endure harsh plant operating environments. Having said that durability, maintenance & furnace life extension to meet the needs for higher productivity and cost reduction is prioritized. The technology has also advanced to improve the diagnosis technique of internal furnace conditions and to effectively repair the damaged walls in the old furnaces or ovens. The required qualities of refractory ceramics in the furnace wall are becoming much higher than before in a wide range of processes.
For TRL turnaround will begin from the raw material prices that have drastically gone down from FY22 levels, and it is expected to bring better margins. At the same time, Investment in their R&D wing has poured in life & witnessed a substantial outcome in the development of new & improved product, improvement on product performance, redesigning, consistency, use of recycle material.
Major emphasis was given to the research in the field of iron making & steel making areas like Trough, Torpedo, Pellet Plant CDQ, Flow Control & CC, Steel Ladle, RH Degasser and BOF.
In stainless steel & non-ferrous area also continuous research work has been carried out to improve the performance of Dolomite, DBMC & High Alumina/Monolithic Products. Also, with huge capex budget allocated for development projects will provide an ample opportunity for TRL.
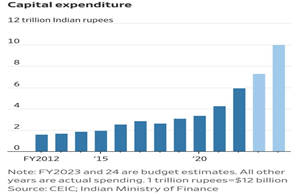
With the current market size of Indian refractories close to around INR 12,000 crores & the projection on growth for infrastructure, automobile and other sectors will have a significant impact on the demand of refractories products. As the growth of steel & cement industries products is directly linked to the growth movement of the refractories & augurs well for the refractories products. It is prudent to believe that rising local demands & surging economy, Indian refractories market is anticipated to outperform their foreign counterparts. Also, initiatives and support from Government of India (GOI), such as, the Aatmanirbhar Bharat, The National Steel Policy, Mission-300, PLI Scheme etc. will give a major boost to the Indian Refractory industry in coming years.
TRL Krosaki has expanded over a period of time & has its fair share of presence in different parts of the world, such as, Asia, Southern America, Europe, Middle East, Africa, Australia & generates close to 15 percent of its revenue from foreign market. It understands the importance of the technology and invest on its research and development for future perspectives and for improving product quality.
Even though refractory industry is confined with a limited number of players and there is no affirmative collaboration within the industry for placing an order despite that TRL manages to add up major chunk of revenue for the firm due to monopoly on certain products like dolomite, alumina graphite & other clay products.
TRL has the following associate companies.
Also, Nippon Steel is having significant influence over holding company: Krosaki Harima
Belpahar Plant, Salem Plant, TRL Jamshedpur, TRL MP, TRL Gujarat, TRL China
RHI Magnesita, Morganite India, Vesuvius India, IFGL, SEPR Refractories India
| Shareholders | Percentage |
|---|---|
| Krosaki Harima Corporation | 77.62 |
| SAIL | 10.54 |
| LIC | 4.61 |
| Others | 7.23 |
Mr. Hemant Madhusudan Nerurkar - Chairman
Mr. P B Panda - Managing Director
Mr. M V Rao - Chief Financial Officer
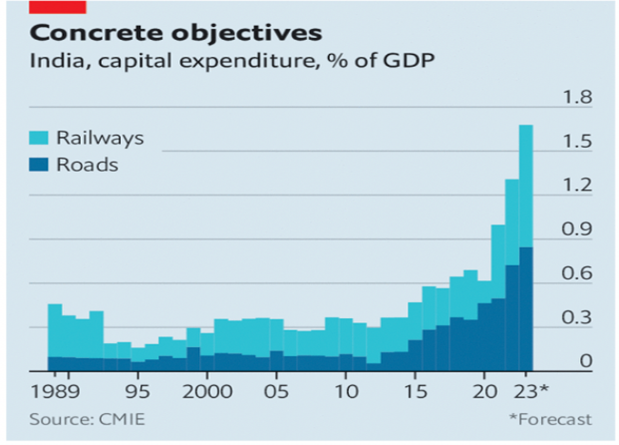
Refractories are the bedrock of heavy industries and move in tandem with them. Increase in infrastructural projects boosted by local demand, surging economy on the back of government and private entities spending under various projects, has created a thriving environment for refractories.
With policies like PLI, Anti-Dumping on metal imports must be celebrated by domestic producers. Having said that regular investment in development of refractories products is quintessential for enhancing the product quality or discovering substitute products. Apart from that monopoly on certain products gives extra leverage for TRL to capitalize on it.
| DESCRIPTION | Mar-23 | Mar-22 | Mar-21 | Mar-20 | Mar-19 | Mar-18 |
|---|---|---|---|---|---|---|
| ASSETS | ||||||
| Non- Current Assets | ||||||
| Property, Plant & Equipment | 457.23 | 392.65 | 300.70 | 240.65 | 202.44 | 194.76 |
| Capital work in progress | 46.83 | 65.83 | 107.16 | 69.35 | 19.14 | 5.24 |
| Financial Assets | 6.09 | 3.71 | 6.70 | 6.78 | 10.96 | 5.22 |
| Non-Current Asset | 2.91 | 2.58 | 1.52 | 10.29 | 9.55 | 10.55 |
| Other Non-Current Asset | 25.16 | 25.42 | 25.80 | 29.79 | 19.45 | 17.58 |
| Others | 53.05 | 53.08 | 51.92 | 61.78 | 40.44 | 38.83 |
| Total Non- Current Assets | 591.27 | 543.27 | 494.05 | 423.20 | 300.83 | 270.70 |
| Current Assets | ||||||
| Inventories | 337.26 | 299.01 | 356.60 | 314.01 | 359.34 | 265.25 |
| Financial Assets | 2.97 | 7.21 | 240.76 | 277.32 | 234.69 | 215.63 |
| Other Current Assets | 25.96 | 29.37 | 34.02 | 58.20 | 65.32 | 54.37 |
| Total Current Assets | 836.46 | 785.55 | 631.81 | 650.76 | 660.46 | 536.35 |
| Total Assets | 1,427.74 | 1,328.83 | 1125.87 | 1073.96 | 961.28 | 807.04 |
| Liabilities | ||||||
| Total Non-Current Liabilities | 100.19 | 149.49 | 167.77 | 144.58 | 38.29 | 41.05 |
| Total Current Liabilities | 598.31 | 574.99 | 443.04 | 417.17 | 483.09 | 394.30 |
| Equity | ||||||
| Equity Share Capital | 20.90 | 20.90 | 20.90 | 20.90 | 20.90 | 20.90 |
| Other Equity | 708.34 | 583.43 | 494.15 | 491.30 | 419.00 | 350.79 |
| Total Equity | 729.24 | 604.33 | 515.05 | 512.20 | 439.90 | 371.69 |
| Total Equity & Liabilities | 1,427.74 | 1,328.83 | 1125.87 | 1073.96 | 961.28 | 807.04 |
| Description | Mar-23 | Mar-22 | Mar-21 | Mar-20 | Mar-19 | Mar-18 |
|---|---|---|---|---|---|---|
| Revenue from Operations | 2,295.01 | 1,920.90 | 1,423.92 | 1,652.91 | 1592.18 | 1190.22 |
| Other Income | 4.12 | 3.06 | 3.73 | 0.84 | 2.10 | 1.95 |
| Total Income | 2,299.14 | 1,923.97 | 1427.66 | 1653.76 | 1594.29 | 1192.17 |
| Expenses | ||||||
| Cost of material consumed | 1,002.25 | 803.18 | 617.69 | 716.83 | 693.34 | 540.14 |
| Purchases of stock in trade | 311.96 | 309.82 | 210.10 | 246.13 | 237.73 | 118.24 |
| D&A | 38.69 | 34.30 | 28.93 | 26.82 | 31.85 | 20.50 |
| Other Expenses | 578.11 | 509.29 | 367.70 | 402.86 | 405.96 | 343.23 |
| Total Expenses | 2,091.83 | 1,791.10 | 1380.47 | 1522.37 | 1464.33 | 1119.72 |
| PBT | 210.67 | 137.12 | 46.54 | 135.57 | 133.42 | 80.77 |
| PAT | 158.26 | 103.73 | 35.71 | 105.37 | 87.59 | 55.34 |
| Total Comprehensive Income | 156.25 | 102.65 | 33.15 | 103.04 | 84.83 | 54.17 |
| EPS | 75.73 | 49.64 | 17.09 | 50.42 | 41.91 | 26.48 |
| Description | Mar-23 | Mar-22 | Mar-21 | Mar-20 | Mar-19 | Mar-18 |
|---|---|---|---|---|---|---|
| Cash Flow from Operating Activities | ||||||
| Net Cash Flow from Operations | 182.89 | 263.83 | 149.12 | 146.05 | 30.03 | 104.56 |
| Cash Flow from Investing | ||||||
| Acquisition of Plants & Property | -89.47 | -98.71 | -116.10 | -129.23 | -44.61 | -25.42 |
| Proceeds on sale of Property | 1.74 | 0.17 | 0.39 | 0.23 | 0.15 | 0.13 |
| FD with bank | -0.06 | 3.40 | -0.01 | -0.51 | -0.08 | |
| Interest received | 0.70 | 0.31 | 3.74 | 0.41 | 0.81 | 0.22 |
| Dividend received | 0.01 | 2.06 | 0.01 | |||
| Net Cash Flow from Investing | -87.07 | -94.57 | -94.77 | -123.83 | -44.15 | -25.13 |
| Cash Flow from Financing | ||||||
| Proceeds from borrowing | 103.49 | 145.31 | 59.75 | 139.38 | 78.18 | 64.53 |
| Repayment of borrowing | 103.49 | 145.31 | -81.91 | -126.66 | -21.81 | -117.27 |
| Payment of lease liability | -2.87 | -2.58 | -2.34 | -2.17 | ||
| Interest Paid | -208.86 | -145.15 | -10.93 | -14.34 | -15.75 | -13.93 |
| Dividend Paid | -313.50 | -133.76 | -30.30 | -30.73 | -16.62 | -15.84 |
| Net Cash Flow from Financing | -992.05 | 706.12 | -53.81 | -33.00 | 24.90 | -82.36 |
| Net cash and cash equivalent | -3.39 | 2.42 | 0.53 | -10.77 | 10.78 | -2.93 |
For any queries, reach out to: unlisted@rurashfin.com or Call: +91 224157 1111